


Charts in Markdown. The numbers are the picture.
Write a table in a Markdown code block. MarkVis draws the chart. Change a number — the picture changes. If the chart cannot draw, you still see the table.
A fence is a fenced code block tagged chart (or markvis, or vis). The numbers live in that block. That is the whole idea.
In 2017 this project was a renderer (GitHub Trending). This is the rewrite: the same name, for people and for AI.
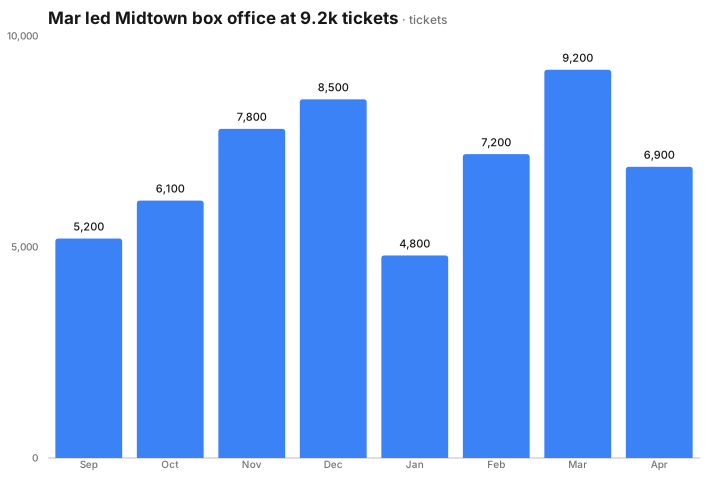
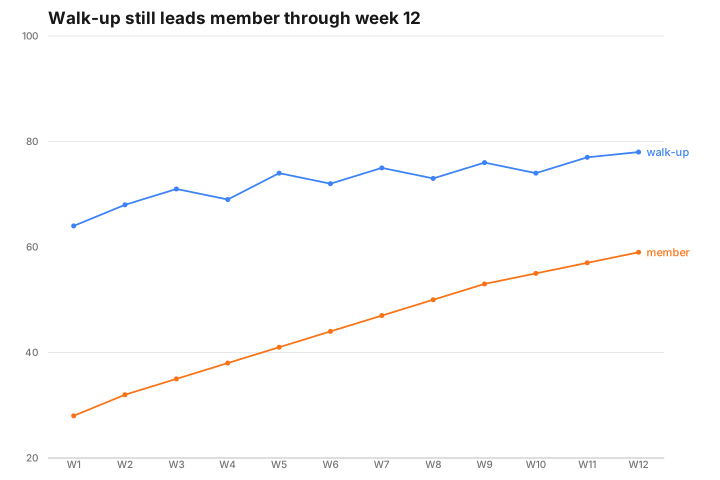
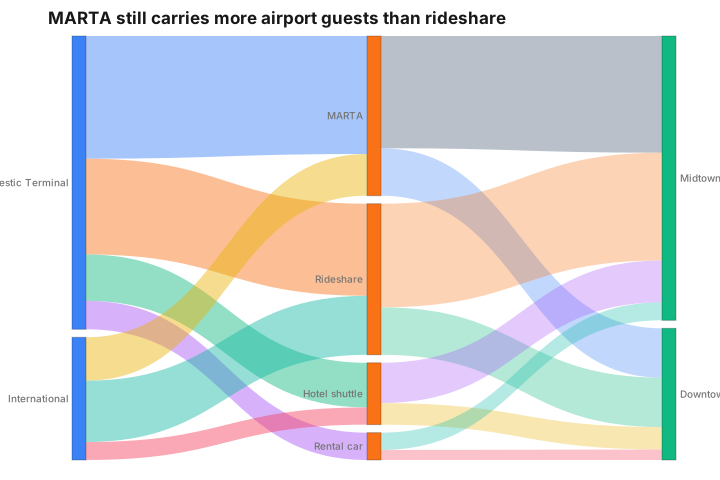

Paste this into Play. Thirteen kinds: bar, line, area, scatter, pie, hist, heatmap, funnel, waterfall, radar, gauge, sankey, treemap. Optional look: theme and palette — SPEC.md.
markvis: 2
type: bar
title: Mar led Midtown box office at 9.2k tickets
unit: tickets
x: month
y: tickets

month,tickets
Sep,5200
Oct,6100
Nov,7800
Dec,8500
Jan,4800
Feb,7200
Mar,9200
Apr,6900
You can also put the numbers in a Markdown table, or use the HTML comment form in examples/valid/08-bar-comment.md.
-
Play — paste a block at markvis.js.org/play. No install.
-
Install —
2.xreplaces0.0.13(the old d3 renderer stays in legacy/).npm install markvis npx markvis bake README.md
bakewrites a picture next to the file and adds a Markdown image so GitHub can show it. The code block stays. The image reference stays pointed at the file just written. Running bake again does nothing if nothing changed.npx markvis check notes.mdchecks every chart block in the file and exits non-zero if any block is invalid.A blank measure cell is missing, not zero. Text such as
N/Ais an error (E_BAD_NUMBER) and the table stays.orient: horizontalon a bar chart is for long category labels. Omitmarkvisfor version 2; any other version is rejected.import { parseMarkdown, renderSvg } from "markvis"; const parsed = parseMarkdown(markdown); if (parsed.ok) { const svg = renderSvg(parsed.chart); } else { // parsed.table still has the rows; parsed.error.code is stable }
-
In a Markdown site — remark or markdown-it. Both return the picture and the data table:
import MarkdownIt from "markdown-it";
import markdownItMarkvis from "markvis/markdown-it";

const html = new MarkdownIt({ html: true })
  .use(markdownItMarkvis)
  .render(markdown);
// html contains <svg> and <table>
import { remark } from "remark";
import remarkHtml from "remark-html";
import remarkMarkvis from "markvis/remark";

const html = String(
  await remark()
    .use(remarkMarkvis)
    .use(remarkHtml, { sanitize: false })
    .process(markdown),
);
-
With an AI — point a model at skills/markvis/SKILL.md or llms.txt. It should write only the fields listed there. Not a PNG. Do not invent a type id.
| Code block tags | chart markvis vis |
| Chart kinds | bar line area scatter pie hist heatmap funnel waterfall radar gauge sankey treemap |
| Fields | markvis type title unit x y series plus theme palette surface. Type-local: layout innerRadius min max orient role |
| Numbers | Comma-separated rows, or one Markdown table. Not JSON as the default. No JavaScript in the block. |
theme: how it is drawn: folio (default) highcharts shadcn docs ant recharts. palette: colors only: ink porcelain warm cool vivid. Unknown look → table + error, never a silent swap. Pie slices are not forced to 100. Rows stay in the order you wrote them.
Get started · Integrate · SPEC.md · Themes · Architecture · Contributing · Release / merge
0.0.13 (the old d3 renderer): legacy/.